Dataviz.Garden
Powered by 🌱Roam GardenDataViz Process – Inspirations
from talk hosted by DataSciencePortugal
Often uses Tableau for proto-typing.
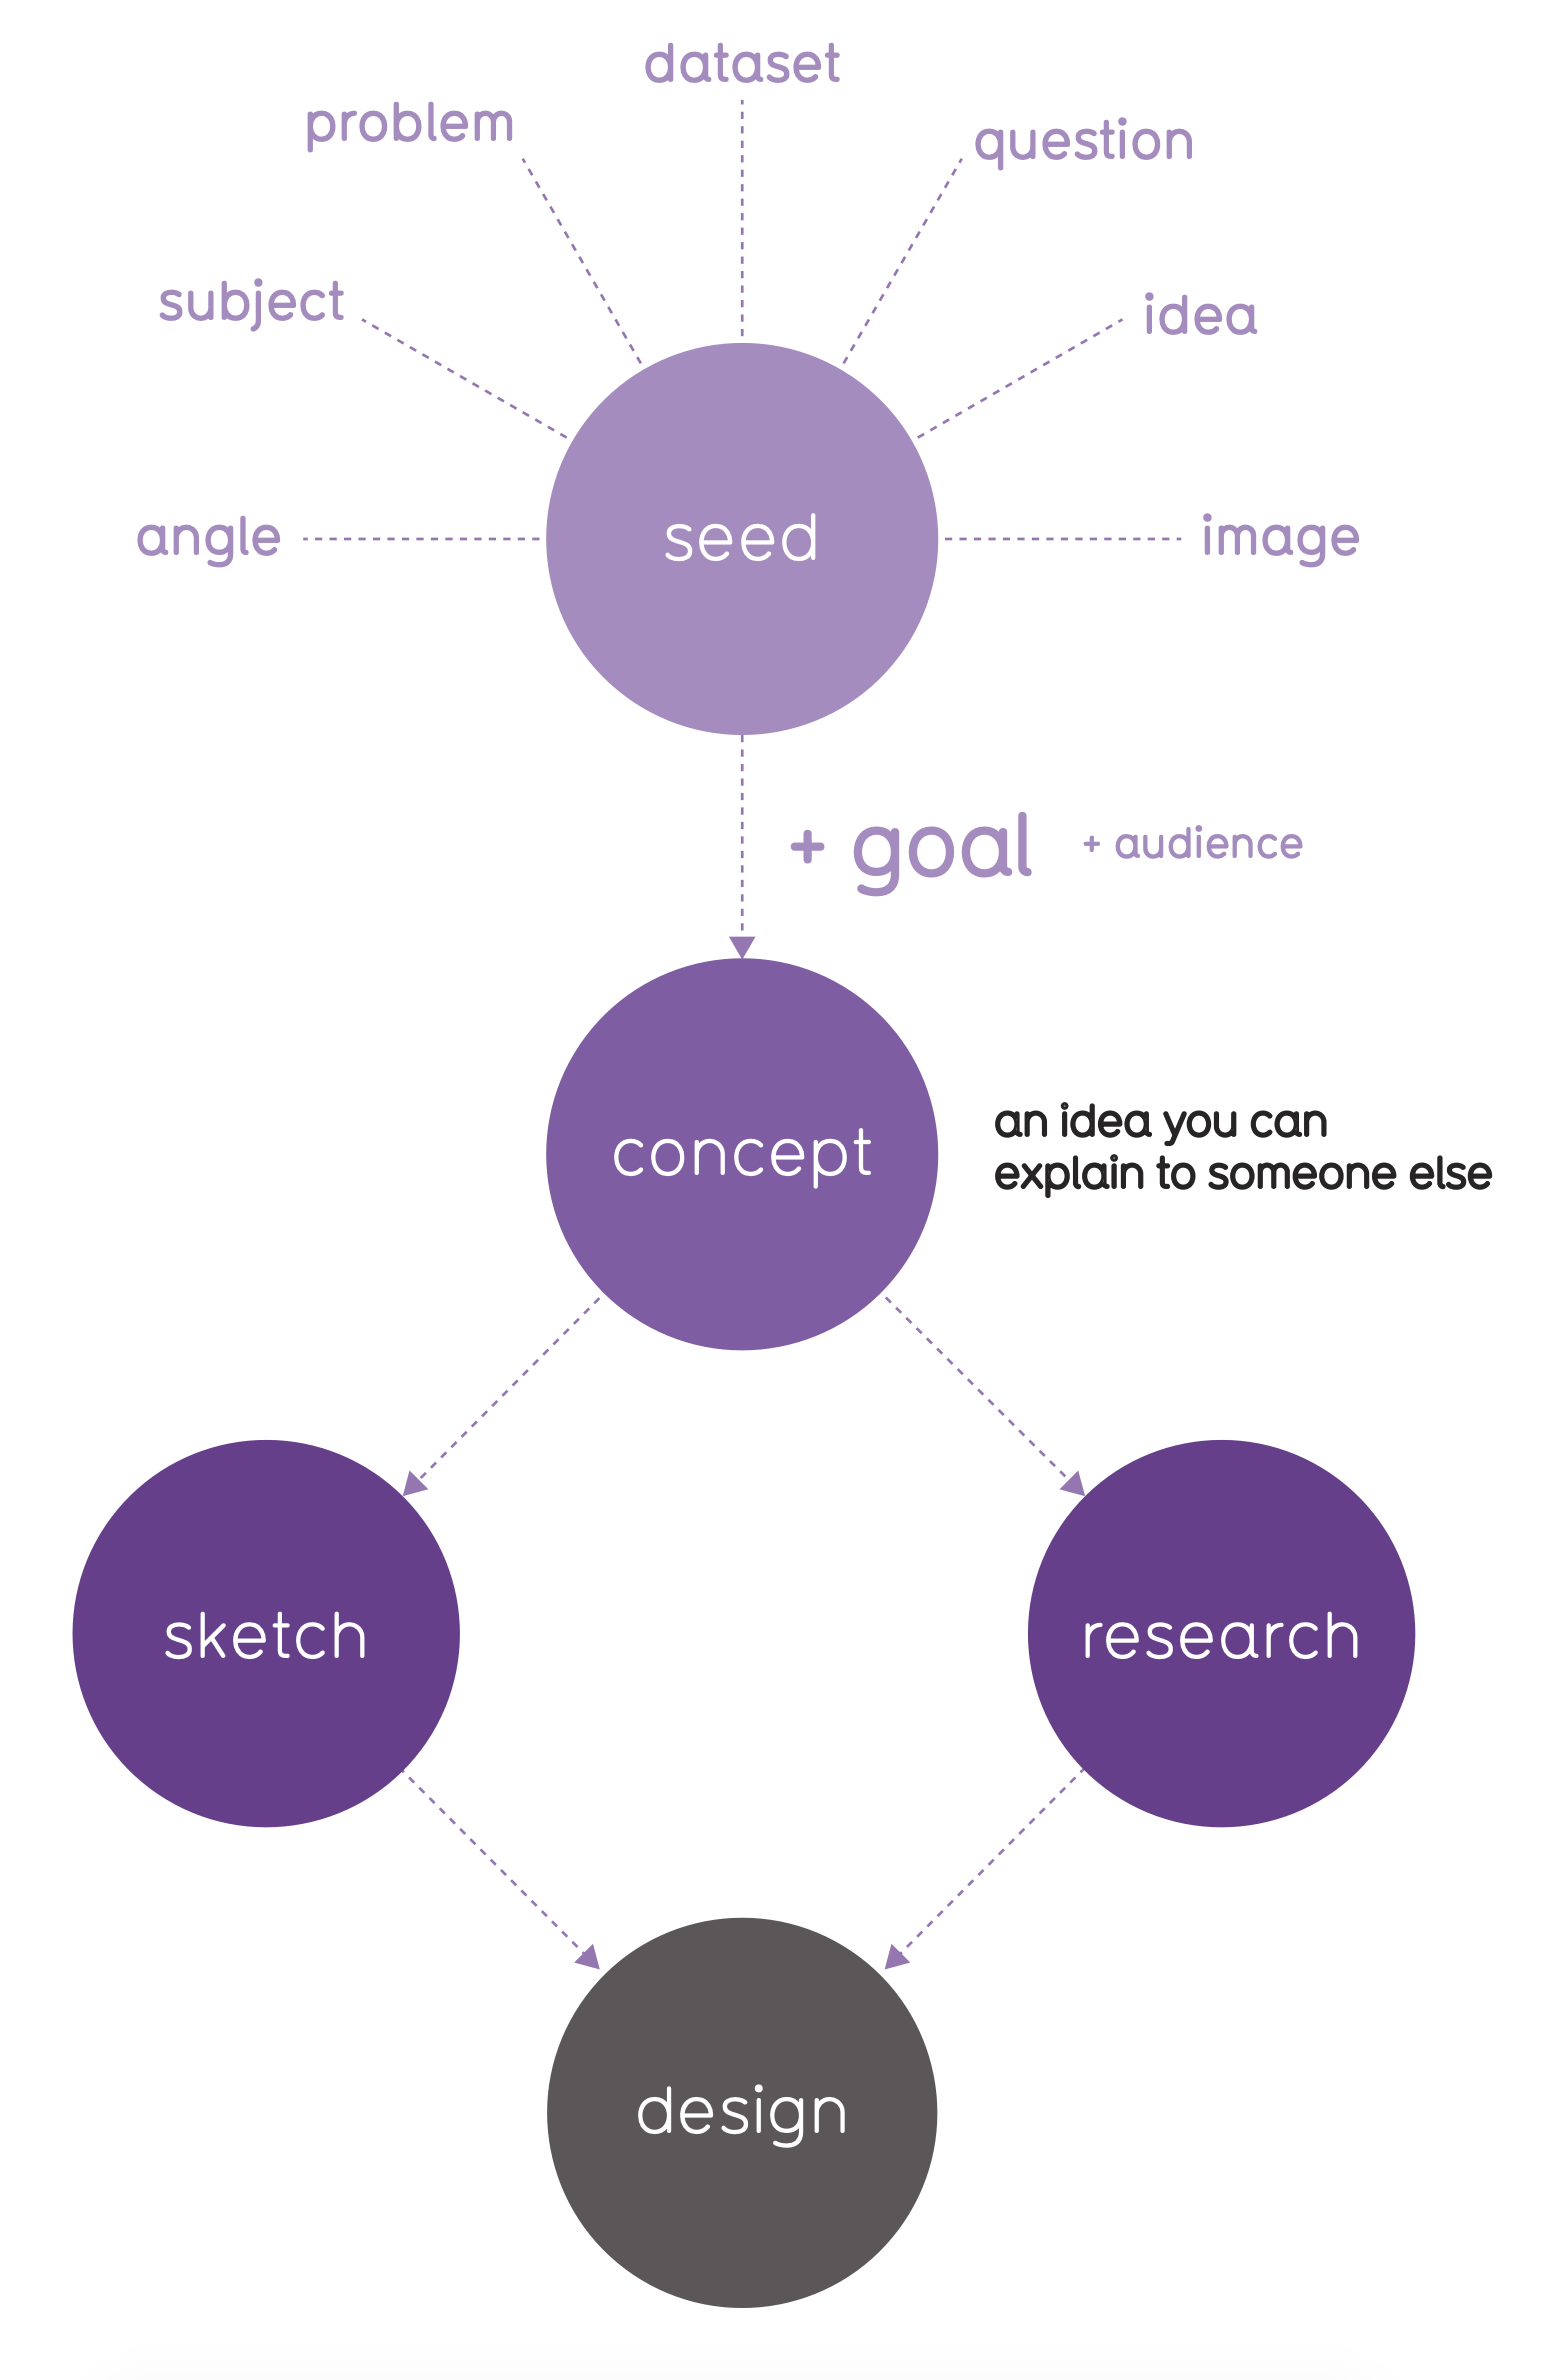
The goal is to quickly sketch various charts and to give the data initial look from various angles.
Datasets tend to be chaotic, so Moritz doesn't believe in mock-ups and designs starting from the idea "data will be here".
Solutions should be data-driven but also user-centric.
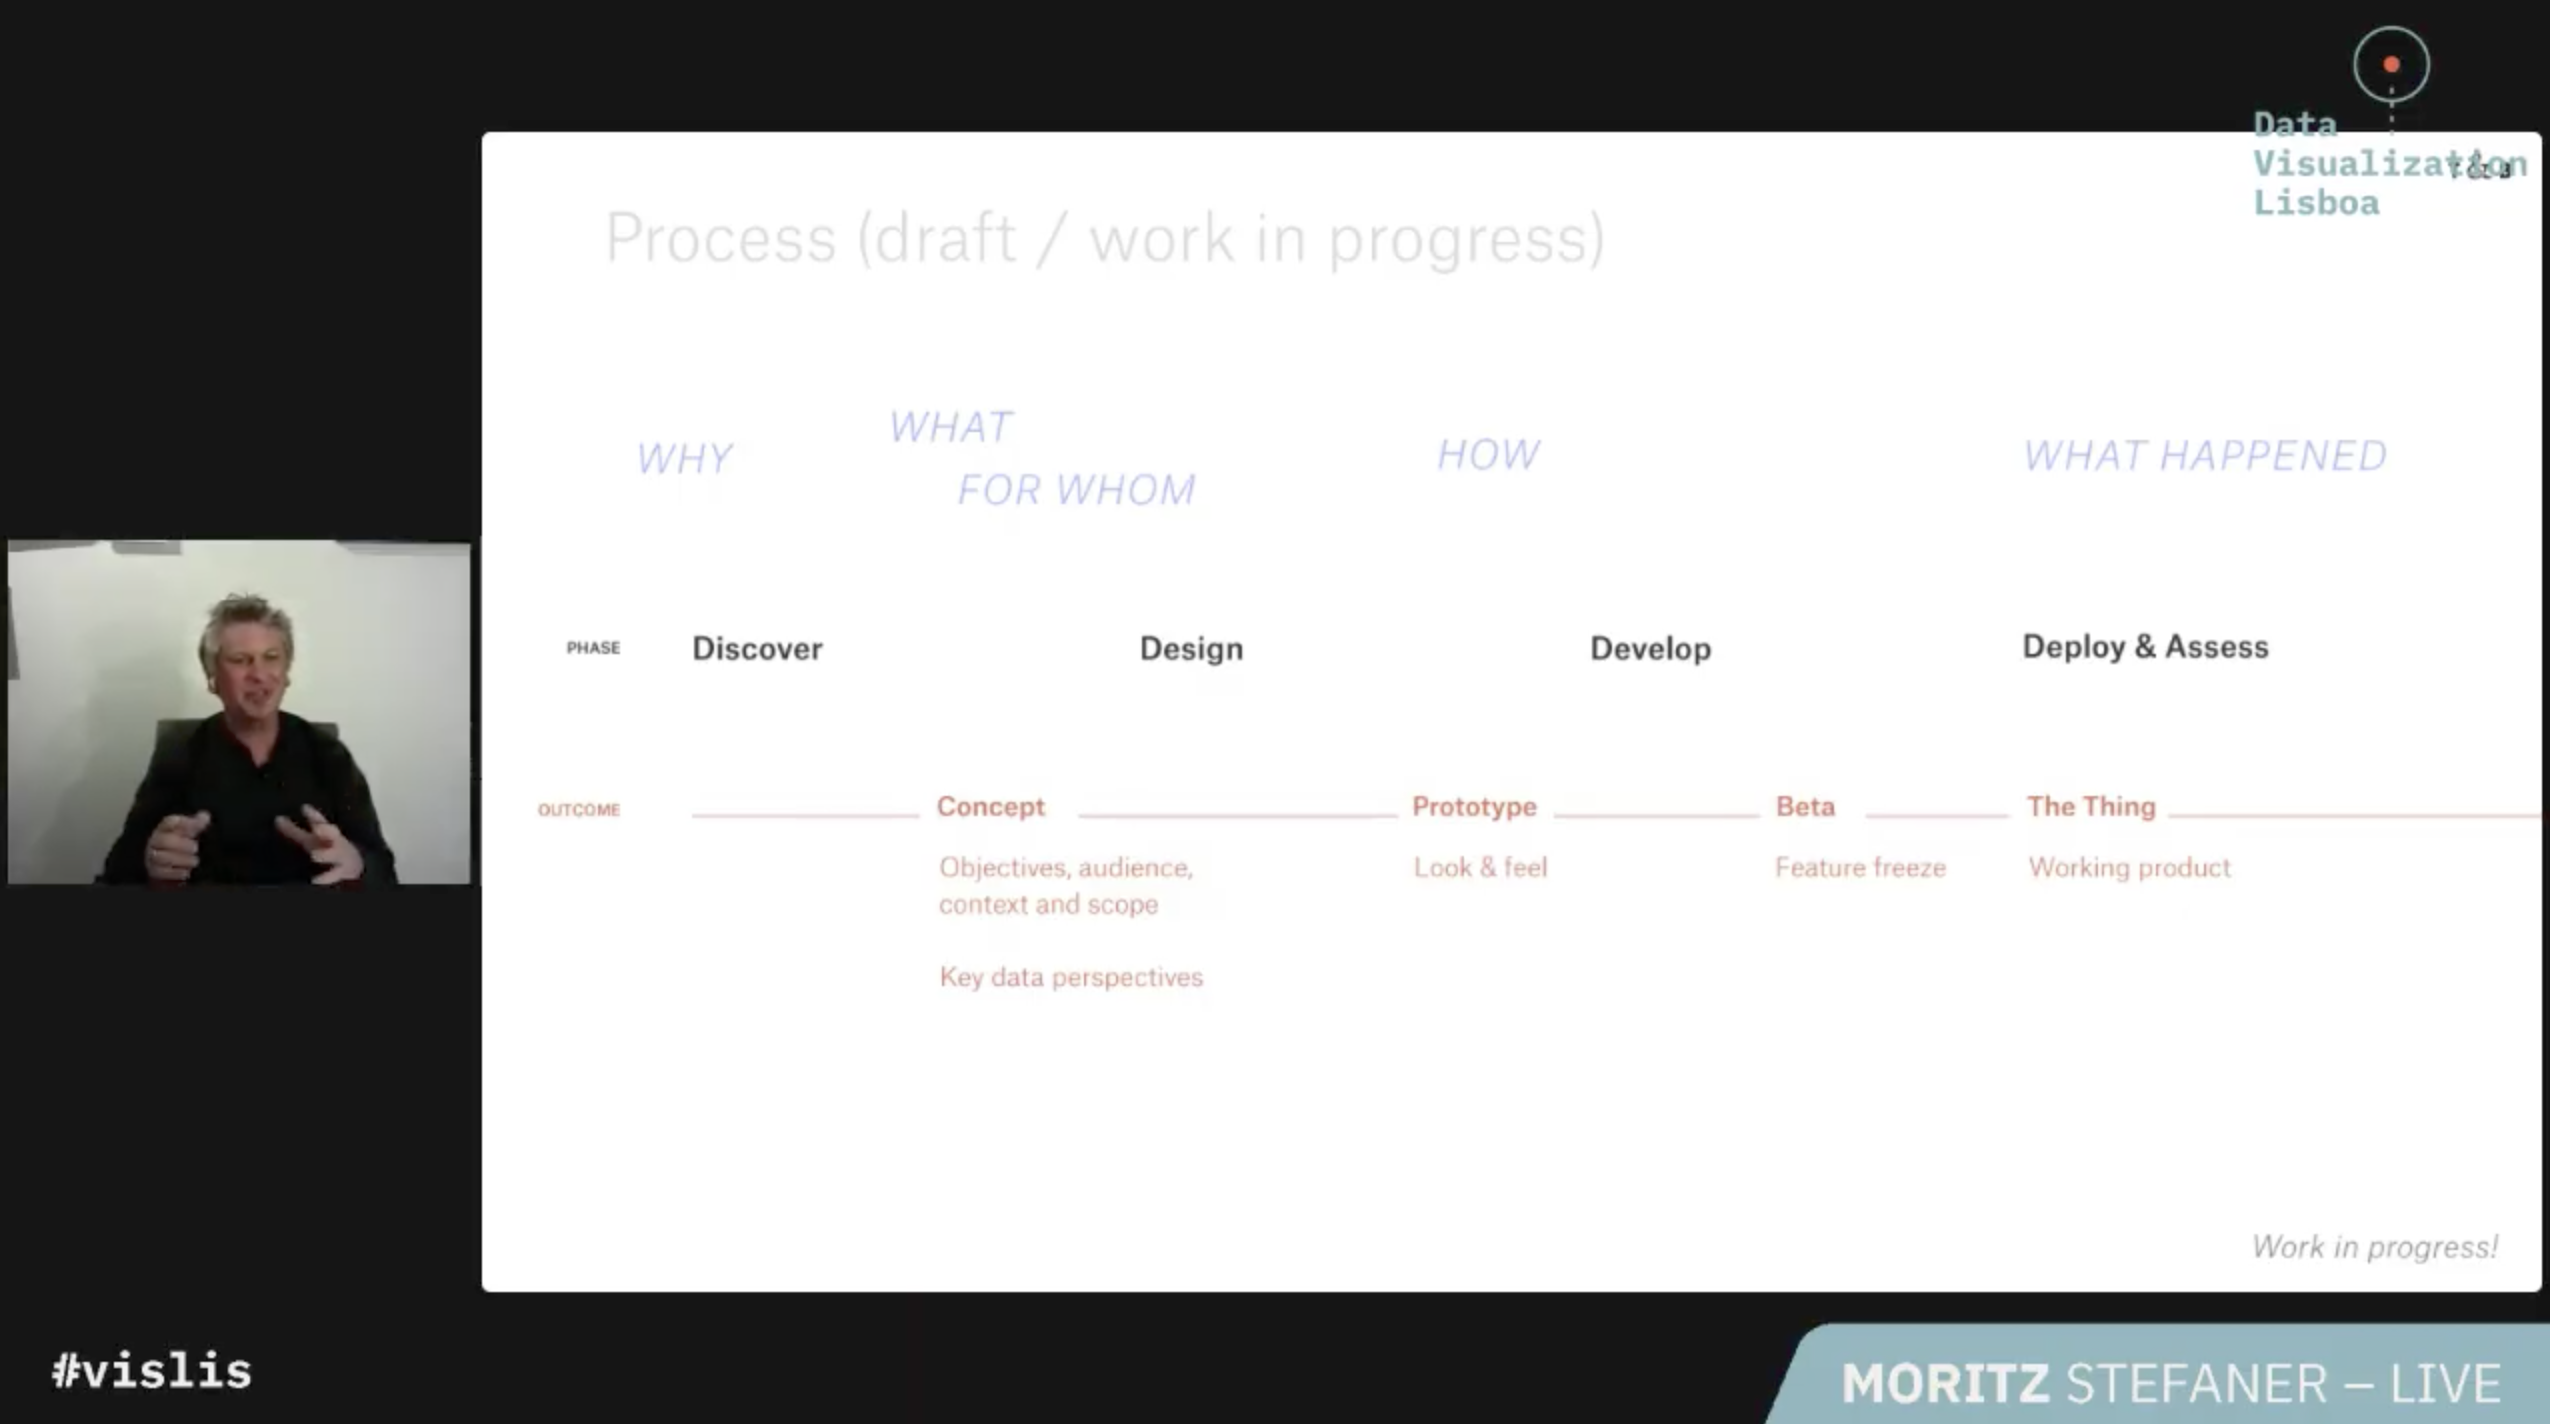
Visualisation can be used as a bootstrapping tool, from ideation through design until the last phases of a project.
It is easy to make mistakes while working with data. So fact-checks and sanity-checks are important. (See also DataViz checklists.)