Dataviz.Garden
Powered by 🌱Roam GardenCreating Impactiful Infographics & Data Visuals – Information is Beautiful (workshop)
Information is Beautiful Method: by David McCandless
Elements ...or What Makes Good Viz?
Concept, question
interesting problem / question / puzzle
Goal, purpose
useful and impactful
Visualisation, design
attractive and digestible
Data, information
sound and trustworthy
what info? facts, stats, issues, theories, relationships
Method Overview
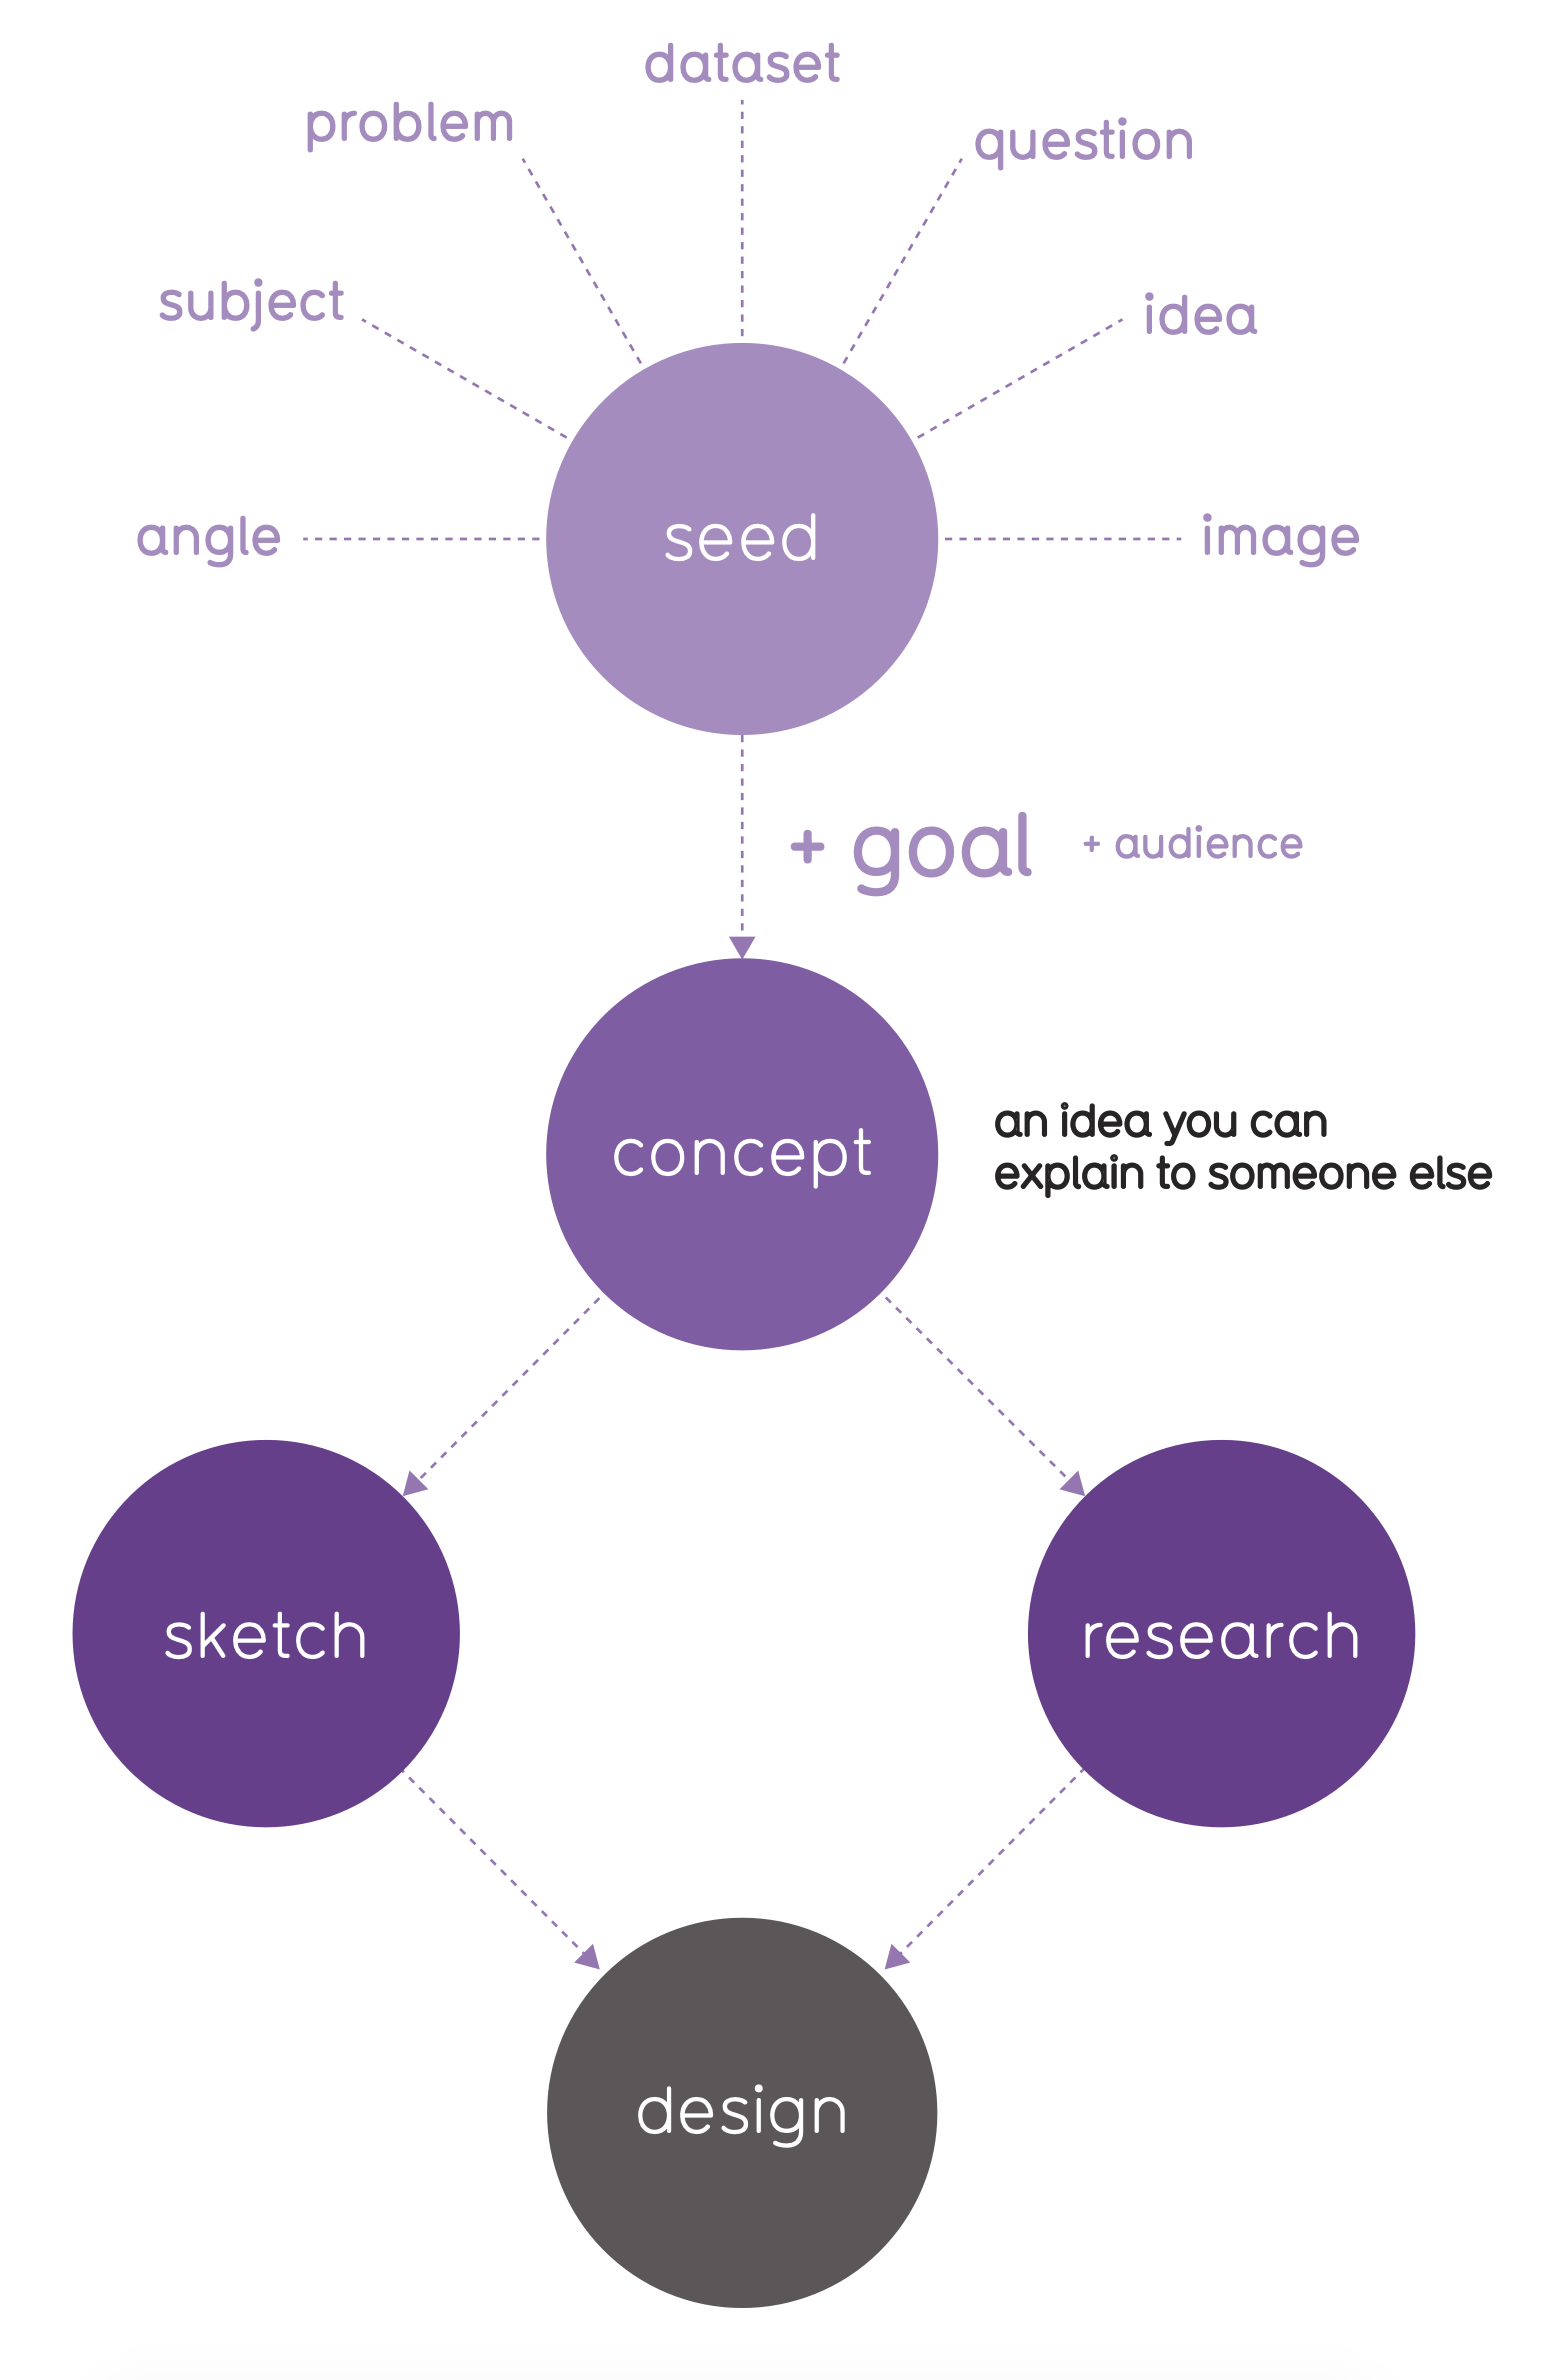
Seed → Concept → Sketch / Research → Design
Concept, question
Seed → Concept → Sketch/Research → Design
IoB method is generally concept-driven
start with a seed → turn it into a concept → begin dataviz work
vs traditional: Data → Concept → Sketch → Design
also used by IoB, but just 10 percent
1. Seed
idea, image, question, dataset, problem, subject, angle, ...
Where to look for inspiration (positive / negative concepting):
boredom → How can I make this interesting? / What do you find really boring?
ignorance → How can I complete this picture? / What don't you know?
bewilderment → How can I clarify this? / What don't you understand?
frustration → How can I make this work better? / What annoys you
2. Goal + Audience
What is the purpose of the dataviz?
What does the message say and why? To what end?
What is the audience? Characteristics of the recepients?
3. Metrics
What's important, interesting or essential
Explore: come up with about 5
Isolate the metrics
Goal
systematic: track development, display a system, give an overview, test solutions
analytic: spot specific data, show trends, compare outcomes, find patterns or outliers
communication: convey a message, reveal something beautiful, support arguments, tell a story, show your audience something
Design
sketching = superpower: always begin with sketches
supereasy, supercheap, superquick, superflexible prototyping
it is NOT drawing (no need to know how to draw)
dataviz = skillful and thoutful encoding of information into visual language that allows quick and easy decoding of the message by the recepient
Methods
Top-down
Bottom-up
Story-driven
Combo
2 types of interactive graphics
light (exhibitory) = rollovers, emphasis
hard (exploratory) = sorting, filtering
generally good idea to 1st develop static version and then, in case, interactive version
starting with interactive brings problems