Dataviz.Garden
Powered by 🌱Roam GardenModes of Thinking & Dataviz
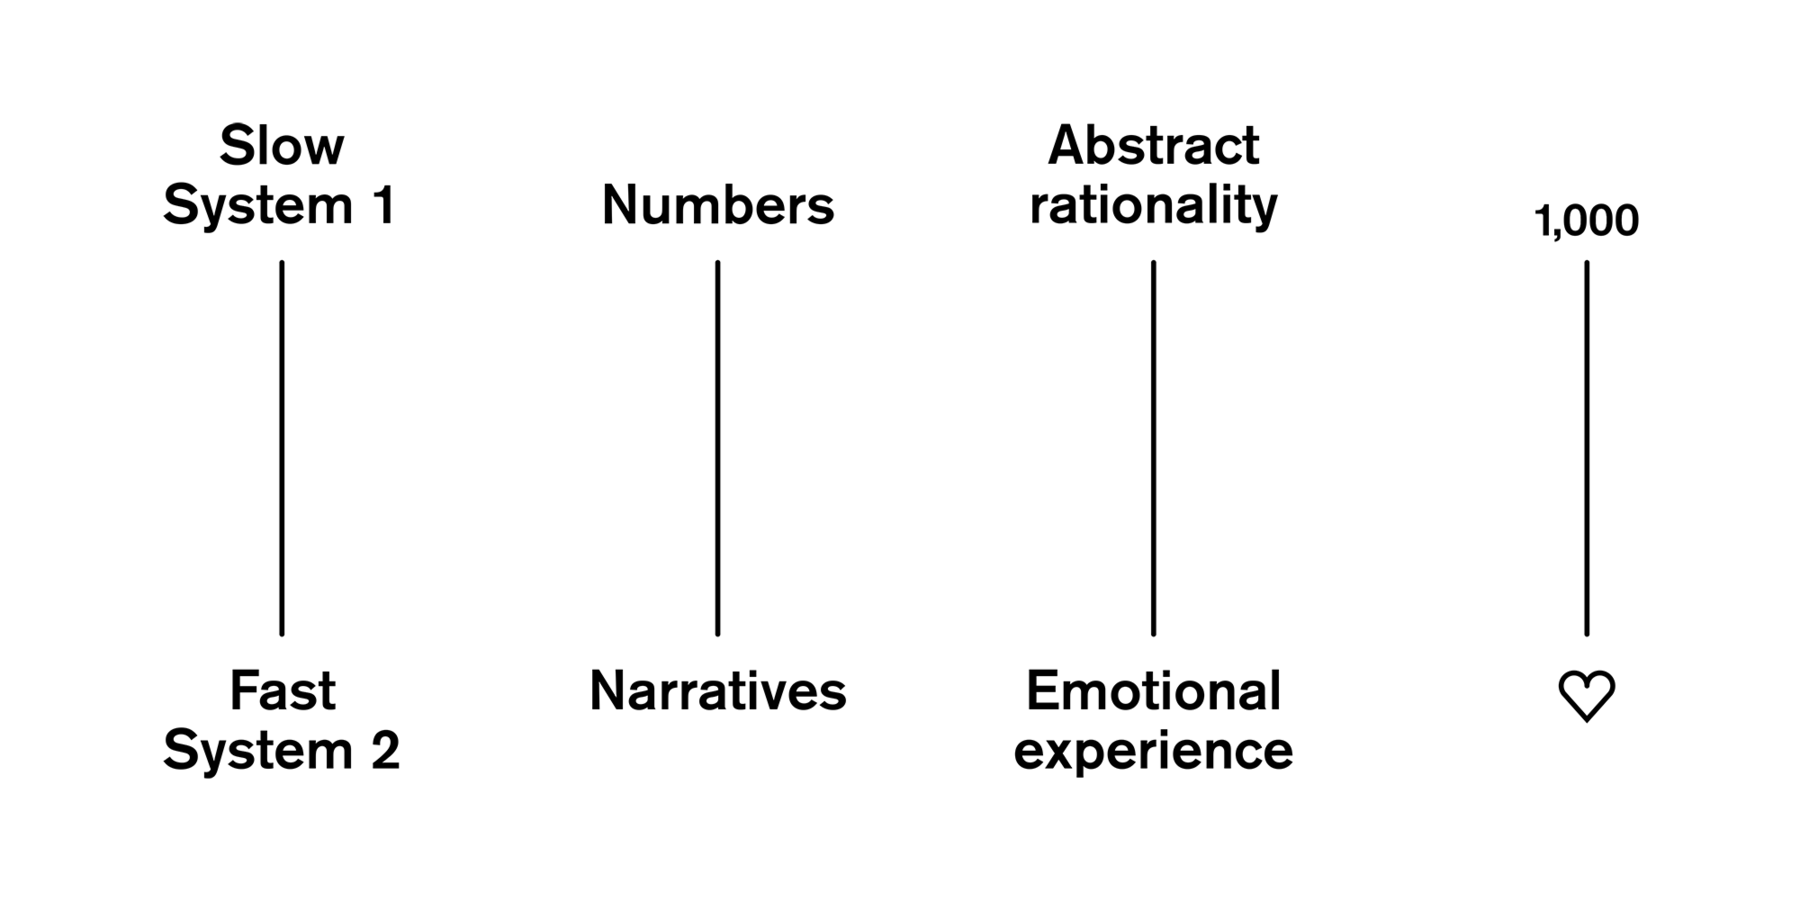
In 2016, Lisa Charlotte Rost gave a talk in which she applied now-famous Kahneman's distinction of two modes of thinking: fast and slow.
Her blog post A Data Point Walks Into a Bar summarises the talk.
Dataviz for both fast and slow thinking
Lisa makes a compelling argument that, like language, dataviz can aspire to speak in both modes: the fast/emotional and slow/analytical.
The question is which to use for what audience. Or, as often will be the case, if the message to one particular audience should combine both modes, how to time & combine them.
We still need to address both modi in fields like news or advocacy: The fast, emotional system to motivate people THAT they should do something (e.g. donating), and the slow, analytical system to help them decide HOW they should do it.
Dataviz with emotional resonance?
It's good to keep in mind how the fast and emotional thinking works when designing vizzes, esp. if the goal is to make the data feel personal.
See the book Thinking, Fast and Slow.
One of the best ways to design for fast thinkers, according to Lisa?
I see especially much potential for the data vis scene in the category “Show what the data would mean for your experience”.
In their discussion of NGOs need for dataviz in Nightingale, Silvia Romanelli and her interviewees (is that a word?? looks like it is) discuss this problem and give two nice examples. The key answer: focus less on graphs, more on story-telling. viz4social-good
Data is used as working material in the design process, but the final output uses storytelling and a personal focus to create empathy.
Another method often used in data journalism to create empathy while leveraging data is combining a chart showing the global extent of an issue with a written testimony of one specific person affected by the situation.
Alternatively, you can let readers interact with the data. Readers enter information about their own situation, so they can see where they sit compared to the rest of the population on a specific issue and how their life could be different if one or two parameters changed.
Examples
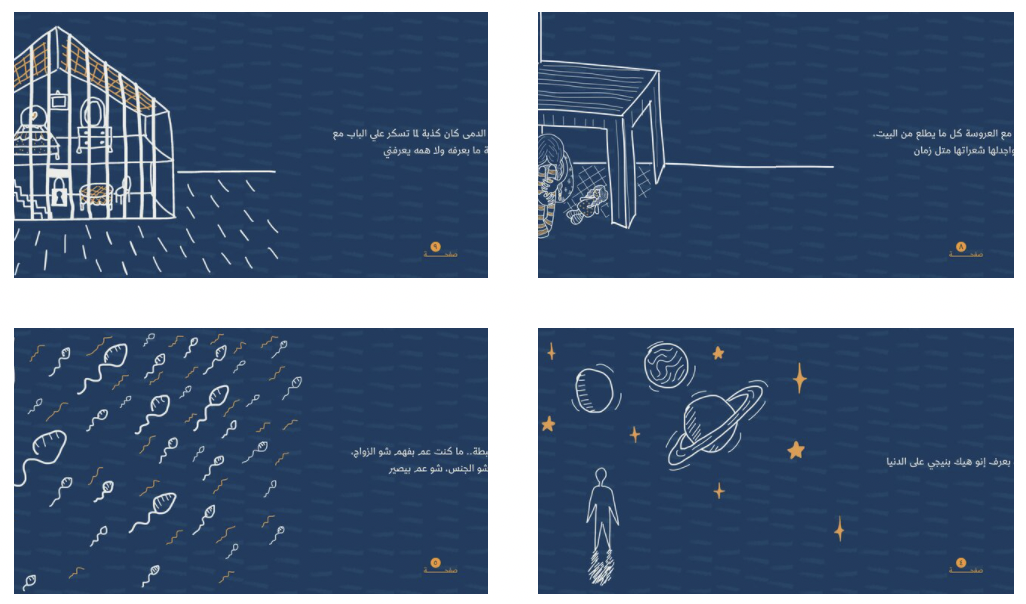
A Bride With A Doll: Arab Women Organization of Jordan works to prevent girls in Jordan from entering early marriage.
For this project, the creative team transformed the numbers into a compelling narrative. The outcome is a printed storybook about a 14-year-old girl who is forced to marry an older man. Her story describes the physical, emotional, and economic consequences of child marriage.
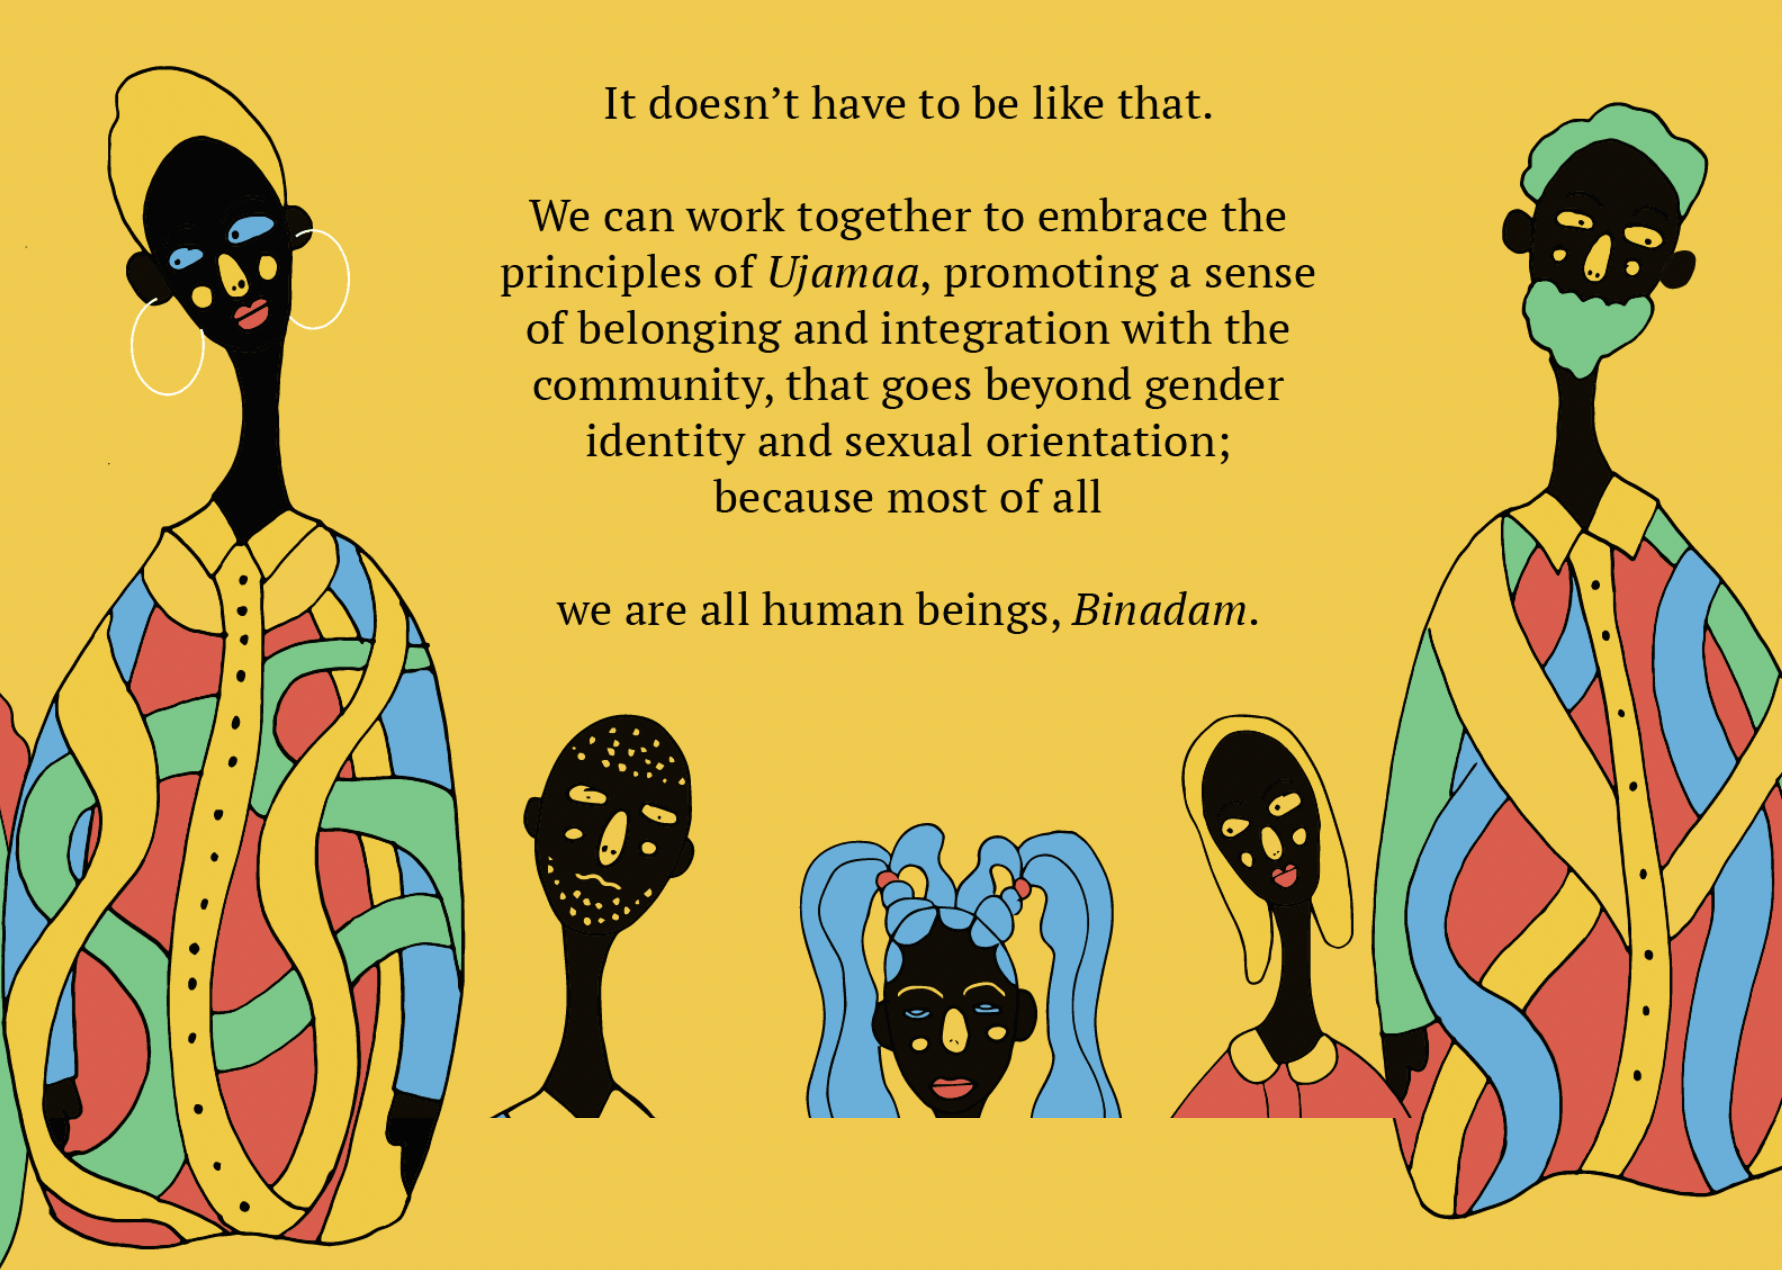
I Am Binadam: In Tanzania, LGBTQ people face discrimination and persecution. The goal was to create a campaign targeting members of the LGBTQ community who had not yet come out and their friends and family.
The team created two fictional characters called Manka and Mashaka. They are composites created from the data and represent two young adults grappling with their sexual identities. Manka and Mashaka humanise the story, making it approachable in a way that charts and graphs could not.